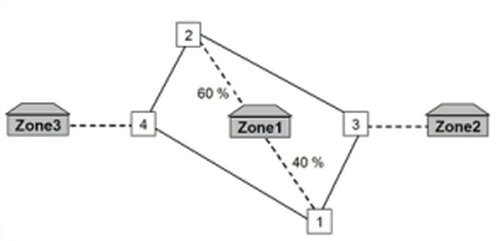
PrT origin and destination demand can be distributed across PrT connectors freely or proportionally. In the case of proportional distribution, there are again two variants: distribution of the total demand or distribution per OD pair (Distribution of demand of a zone to the connectors).
Free distribution
During route search, only the connector time is considered and travel demand is distributed without further constraints onto the routes with the lowest impedance.
Proportional distribution of total traffic
Before the route search is carried out, the share of total origin and destination traffic is calculated for every zone whose demand is to be distributed proportionally. From this, a virtual connector capacity (= proportion • origin/destination demand) can be deduced for every connector which modifies the impedance of the connectors during assignment in such a way that proportional distribution is achieved. The correspondence between the distribution of the assignment and the predefined values depends on the selected assignment procedure and the selected VD function for connectors. A steep VD function should be used. In addition to this, the connector times must not be too low so that the connector impedance has an effect on the route search. When using this option, it should be noted, that the distribution may have very different effects on the individual OD pairs. If the link impedance equals the displayed lengths, practically all trips from zone 1 to zone 3 lead via node 2. The vast majority of trips from zone 1 to zone 2 however are made via node 1.

Illustration 79: Example network for proportional distribution of the travel demand
- Example: Connector capacity determination for proportional distribution of the total traffic (Illustration 79)
Zone 1 has proportional distribution
Zone 2 has proportional or absolute distribution
Zone 3 has proportional or absolute distribution
Travel demand from zone 1 to zone 2: 1,000 trips
Travel demand from zone 1 to zone 3: 400 trips
Origin demand zone 1: 1,400 trips
Connector zone 1 ⇒ node 1: 40 % proportion
Connector zone 1 ⇒ node 1: 60 % proportion
Capacity of connector zone 1 ⇒ node 1 is 40 % x 1,400 = 560 trips
Capacity of connector zone 1 ⇒ node 1 is 60 % x 1,400 = 840 trips
Steep VD function for connectors, for example BPR function with a = 1, b ≥ 4, c ≤1
Proportional distribution of each individual relation (MPA)
Alternatively, the proportional distribution can be applied to each OD pair. This leads to the following distribution in the example above:
- Example: determination of connector capacity for proportional distribution per OD pair:
Zone 1 ⇒ node 1 ⇒ zone 2 with 40 % • 1,000 = 400 trips
Zone 1 ⇒ node 1 ⇒ zone 3: 40 % • 400 = 160 trips
Zone 1 ⇒ node 1 ⇒ zone 2 with 60 % • 1,000 = 600 trips
Zone 1 ⇒ node 1 ⇒ zone 3: 60 % • 400 = 240 trips

